
Do you want to make attractive and powerful data visualization for your site? If yes, you are in the right way. Today in this article I am going to discuss best data visualization plugins which will make your site attractive. You are also able to get huge traffic on your site.
Data visualization refers to representing your site’s data visually. If you implement such plugins, you are able to make an attractive visual appearance. With this plugin, you can create infographics, charts, tables, and maps. These are the best too to represent your data in a managed.
So go through the listed plugins, I am sure you will get the best option for your upcoming site. Here have a look.
POWr Graph
POWr Graph is one of the most powerful data visualization plugin which represents your data flawlessly. It is easy to use and implement such that even beginners can deal with it very well. POWr Graph supports several chart types and provides control over data. Since the plugin has a user-friendly layout, anyone with a basic can go through it.
Features:
- Free of cost
- Easy to use and customize
- Responsive for mobile
- Provides several customization styles
- 10X10 data fields
- Easy to edit
TablePress
TablePress is responsible for creating a table and managing your WordPress website. It has a user-friendly layout with which you can make powerful data visualization. The plugin allows you to add formulas to the tables within a site. With its interactive dashboard, one can make their data visualization attractive and can attract more audience.
Features:
- Pagination and Sorting
- Live preview option
- Offers template tag function
- User-friendly platform
Google Chart
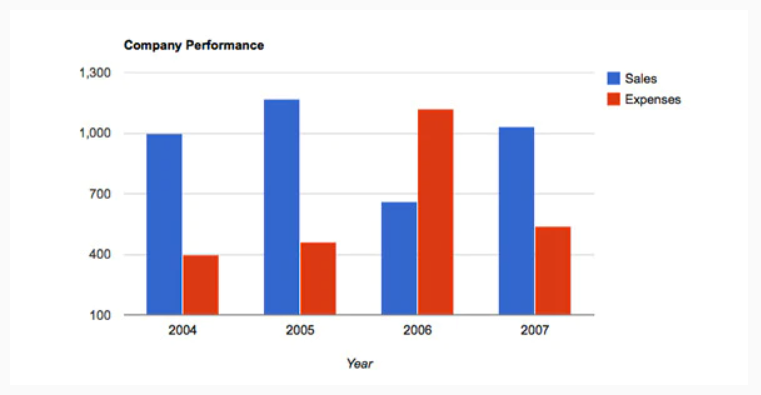
Google Chart helps you to represent your data with attractive and interactive charts and tools. Despite being free, it offers several amazing features that provide you an outstanding experience for your user. It includes a variety of charts, a treemap and scatters chart.
Features:
- Provides energetic data
- Comes with customizable charts
- Compatible with cross-browser
- Attractive and managed dashboard
Snowball
Likewise, Snowball is a powerful WordPress plugin with which you can create powerful articles. It will attract more audiences and make your site engaging. With this, you can create unique articles so that you can make the visualization of your site’s data attractive. It also comes with easy blocks for side notes, tables, image comparisons, videos, bar graphs, tables of contents, and many more.
Features:
- Helps you to create a unique article
- Easy to use interface
- Allows you to edit the code as per requirements
- Supports different contents like text, videos, images, data visualization, interactive widgets
Visualizer
If you want to create interactive data visualizations for your site then Visualizer is the best option for you. It offers 9 types of charts: line charts, area charts, bar charts, column charts, pie charts, geo charts, table charts, bubble charts, and scatter charts. You can use this plugin to create attractive tables like a pricing table with easy access. It is the best option for creating graphs and charts just for free.
Features:
- Helps you to create interactive data visualization
- Offers 9 types of charts
- Also available in the premium version
- Attractive graphs and charts
wpData Tables
wpData Tables is easy to use plugin just as an excel. It allows you to add data and create a chart very easily along with a managed graph. The plugin has a responsive layout, it means your site looks great even in mobile devices. Your users are allowed to edit the charts in a real-time as per their requirements. It is quite impressive for them, isn’t it? Not only that, but you are also allowed to create filters for your data which shows the result from particular dates, location and time.
Features:
- Easy to use
- Mobile friendly
- Editable tables
- Well detailed documentation
- Available in both free and premium version
Infogram
Infogram provides easy to use editor so that you can make your data visualization attractive and powerful. It allows you to integrate infographics and charts within your WordPress website. The plugin offers stunning pie charts which make your customization more powerful. Not only that, but you can also even design your own word clouds and infographics to make your data powerful and engaging.
Features:
- Easy to use editor
- Comes with 550+ maps
- Easy data importing
- 35+ charts
- Interactive reports
- More than a million icons and images
WPBakery Page Builder

Similarly, WPBakery Page Builder fastest and easy to use data visualization plugin for any WordPress website. It offers an unlimited designing option which makes your site attractive and powerful. With this, you can create amazing customs and responsive website layouts. If you want to display complex data in ways your viewers will admire, then WPBakery will be the perfect option. You need not hire any expert or coder, with a basic knowledge even a beginner can deal with it very well.
Features:
- Comes with built-in page elements for graph
- Attractive galleries
- 50+ premium content elements
- SEO Optimized
- Pre-defined layouts
- 40+ unique grid templates
Data Tables Generator
Another amazing data visualization plugin in our list is the Data Tables Generator. It allows you to create a responsive table that will manage your data in an attractive way. The plugin is available in both free and premium versions. If you go through its pro version, you will be able to create charts and graphs through Google Charts Technology. Not only that, but it also helps you to import data from CVS, Excelling, PDF, and Google Sheets.
Features:
- Creates responsive tables
- Available in both free and premium version
- Comes with Google Charts Technology
- Integrated with WooCommerce
DW Chart
Likewise, DW Chart is a premium plugin that helps you to create beautiful charts for your WordPress website. It is responsive for all sizes of screen, which means your site looks great even on mobile. With its admin panel, you can easily insert charts visually. Here you will get different chart types that will integrate with data to attract huge traffic.
Features:
- Creates beautiful charts
- Responsive layout
- Offers 10+ charts
- Highly customizable
- Engages Google visualization API
Responsive Charts
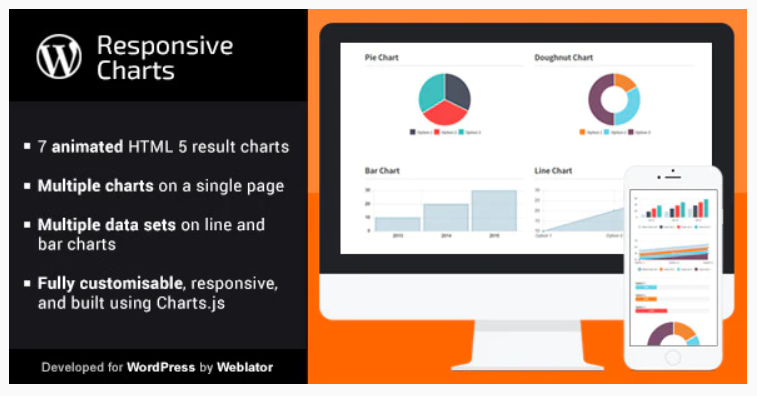
Last but not least, Responsive Charts are the best plugin to create HTML 5 animated charts for your WordPress website. With its formatted chart which is used to represent data, you can make your site responsive and attractive. Moreover, you can also use multiple charts on the same page.
Features:
- Offers 7 different animated chart types
- Responsive layout
- Fully customizable charts
- Easy to understand presentation
Conclusion
Finally, we did with all the listed data visualization plugins. All the above plugins come with outstanding features. I assure you will able to make your data visualization more powerful and attractive. So go through these plugins and get the best one for you.
I hope this article is helpful to you. If you are getting any trouble, let us know about it. You can send your queries to our comment box. We heartily accept all of those and try to answer them all as soon as possible. Keep visiting our website for more such articles.


Excellent post, i have used TablePress and Google Chart Plugins Data Visualization on my Blog. Thanks for sharing these ideas.